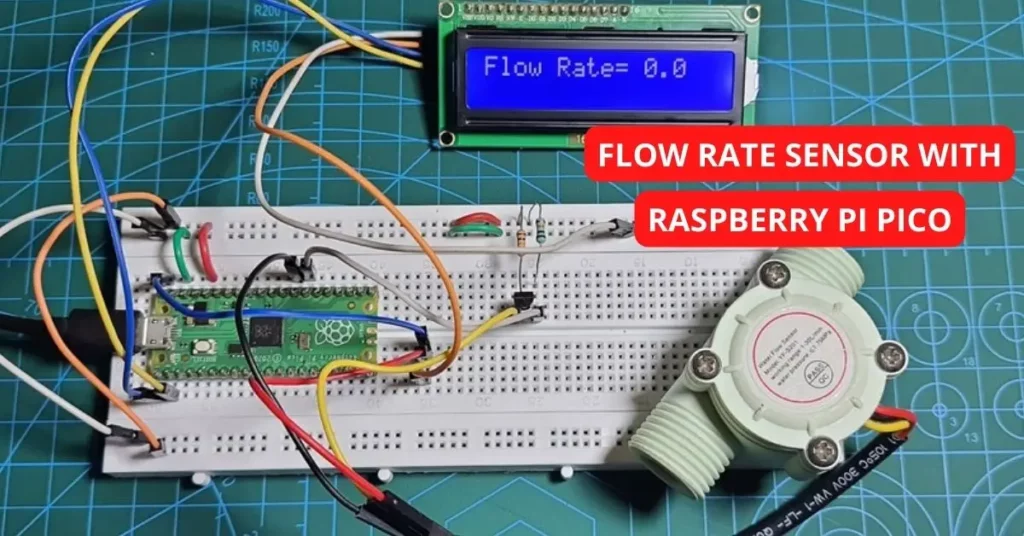
In this article, we will interface the popular YF-S201 water flow sensor with Raspberry Pi Pico RP2040. We shall use an interrupt to measure the volume of water passing through the flow sensor. The project is explained using MicroPython and will work on all versions of Raspberry Pi Pico including the Raspberry Pi Pico W.
Overview Of YF-S201 Flow Rate Sensor
How The Flow Sensor Works
The YF-S201 Flow Sensor can be used to measure volume and flow rate. It works on the principle of the Hall Effect. According to Hall Effect, when a current-carrying conductor is placed in a magnetic field perpendicular to the current direction, an electric field is induced in the conductor perpendicular to both the electric current and the magnetic field. Let us look at the internal diagram of the YF-S201 flow sensor.

The arrangement consists of a freely rotating wheel placed inside an outer case. The outer case is made waterproof using O-rings and keeps the electronics components isolated. The wheel has a permanent magnet attached near its center. The magnet rotates along with the wheel when a liquid flows through the sensor. This creates a rotating magnetic field which induces a voltage in the Hall Effect Sensor. The Hall Effect Sensor then sends pulses, and a microcontroller can read the pulses to estimate the liquid flow rate through the sensor.

Close-up view of the Hall Effect Sensor Inside the YF-S201 flow sensor. This circuit is well protected from water damage by rubber seals.
.
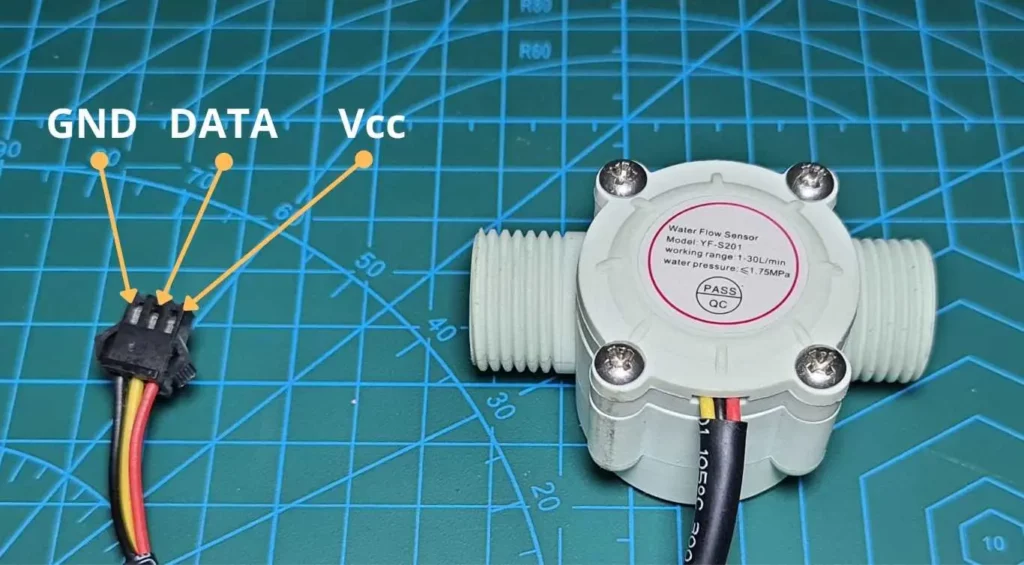
YF-S201 Flow Sensor Pinout
The YF-S201 flow sensor has three wires colored red, black, and yellow. Their description is given below.
| Wire Color | Description |
| RED | Power(5V-24V) |
| BLACK | Ground |
| YELLOW | Data(Square wave pulses) |
Here is the pinout of the commonly available flow sensor module:
YF-S201 Flow Sensor Specifications
- Supply Voltage: 5 to 24V DC
- Flow Rate: 1 to 30 Liters/Minute
- Sensor Output Voltage: 5V TTL
- Accuracy: ±10%
- Maximum liquid pressure: 1.75 MPa
Read more about the working of a Flow Sensor in our article – Water Flow Sensor Pinout, Working & Interfacing Explained
Prerequisites For This Tutorial
- A Raspberry Pi Pico running MicroPython.
- YF-S201 flow sensor.
- A Small signal NPN transistor.
- 2 pieces of 10K Resistors.
- USB cable(USB A To USB Micro-B).
Please ensure that the MicroPython UF2 file is preloaded to RP2040. You can check out our article Getting Started With Raspberry Pi Pico & Raspberry Pi Pico W | Using MicroPython, where we describe all the steps required to set up Raspberry Pi Pico.
How To Interface Flow Rate Sensor With Raspberry Pi Pico RP2040
The Hall Effect Sensor provides data in the form of square wave pulses. We can calculate the frequency of these pulses to find the flow rate. According to the datasheet, the following is the relationship between the flow rate and the corresponding frequency. There may be an error of ± 10% in readings.
| Flow Rate(Litres/Hour) | Frequency(Hertz) |
| 120 | 16 |
| 240 | 32.5 |
| 360 | 49.3 |
| 480 | 65.5 |
| 600 | 82 |
| 720 | 90.2 |
From the data given above and after leaving some margin for error, we can calculate the flow rate by using the formula:
Flow rate (L/min)=Frequency (Hz) / 7.5
As the flow sensor requires at least 4.5V to operate, we will use 5V as a supply for the flow sensor. However, the Raspberry Pi Pico supports only 3.3V inputs. So we need to convert the 5V output from the YF-S201 flow sensor to 3.3V. We will use a Logic Level Converter for this purpose. The Logic Level Converter can be made using a transistor or MOSFET. You can also use a ready-made Logic Level Converter module. To learn more, read our in-depth article – What are logic-level converters and how do they work?
Here is the schematic of a 5V to 3.3V logic level converter using an NPN transistor. I used the commonly available BC547 NPN transistor for the circuit.
You can also use a logic-level converter breakout board like the one shown below.

Let us now try to connect Raspberry Pi Pico and the flow sensor.
Schematic – Flow Rate Sensor With Raspberry Pi Pico
Connect your Pi Pico, Flow Sensor, NPN transistor, and resistors(10K) as shown in the diagram below. The 3.3V output pin 36 is connected to the two 10K resistors. The emitter of the NPN transistor connects to the DATA pin of the flow sensor, and the collector of the transistor connects to the GP21 of Pi Pico.
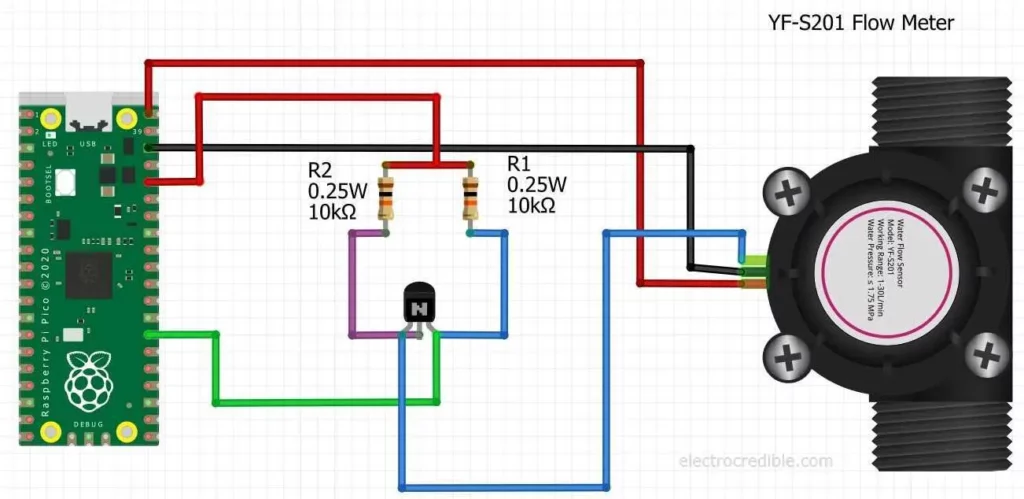
Given below is the schematic of Raspberry Pi Pico with the flow sensor. You can use any of the commonly used NPN transistors such as BC547, 2N2222A, 2N3904, or other such small signal transistors.

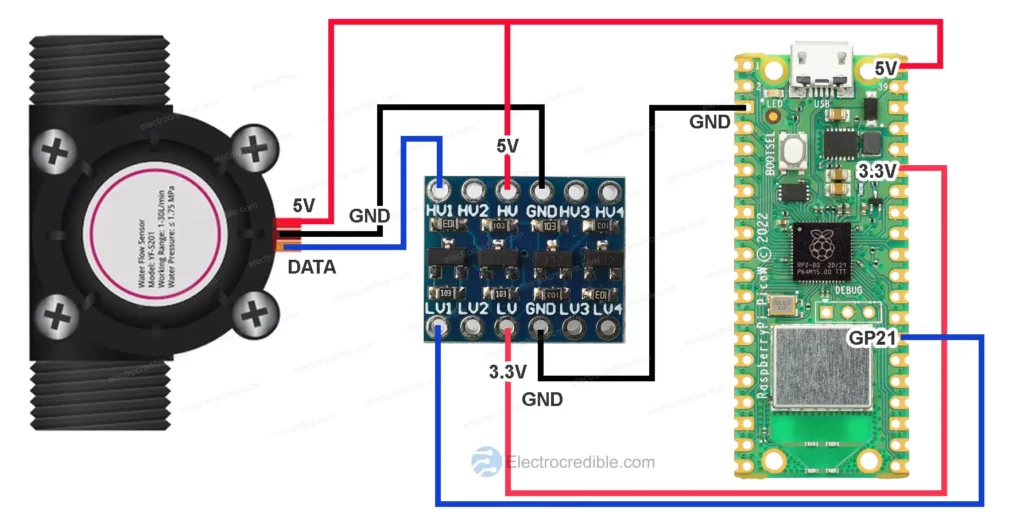
Alternatively, you can connect the flow sensor with Pico using a logic level converter as shown-
Raspberry Pi Pico Flow Sensor MicroPython Code
- Connect your Pi Pico to your PC using a USB cable. Open Thonny IDE and paste the following script in the blank space.
# Program to read flow sensor and display flow rate in Serial Monitor.
# Source: Electrocredible.com, Language: MicroPython
from machine import Pin
import time

flow_frequency=0
flow_rate=0
lastcallTime=0

pin = Pin(21,Pin.IN,Pin.PULL_UP)
def callback(pin):
    global flow_frequency
    flow_frequency=flow_frequency+1
pin.irq(trigger=Pin.IRQ_RISING, handler=callback)

while True:
    if ((time.ticks_ms()-lastcallTime) > 1000):  #if time interval is more a than 1 second
        flow_rate = (flow_frequency * 60 / 7.5)  #flowrate in L/hour= (Pulse frequency x 60 min) / 7.5
        flow_frequency = 0                       # Reset Counter
        lastcallTime=time.ticks_ms()
        print("Flow Rate={} Litres/Hour".format(flow_rate))   #print(flow_rate)
Code language: PHP (php)- Click the green-colored ‘Run’ button.

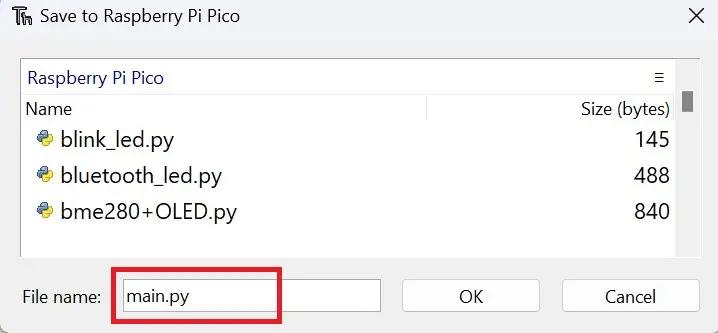
- Save your script to Raspberry Pi Pico when a prompt appears
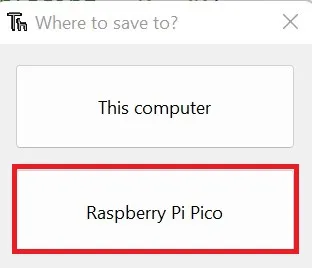
- Save the script as main.py or with any other name with a “.py” filename extension.
After you run the script, blow air into the flow sensor or pass water through it. You should now see the flow rate displayed on the Serial Monitor of your IDE. In Thonny, the Serial Monitor is displayed in the lower part of the IDE.
Here is the output that I got in the Shell of Thonny IDE by passing water through the flow sensor:

Flow Sensor Code Explained
First, we import the Pin class from the Machine module to interact with the GPIOs of Pi Pico. We also import the time module.
from machine import Pin
import timeCode language: JavaScript (javascript)
We then declare three variables that will be used to calculate the flow rate mathematically.
flow_frequency=0
flow_rate=0
lastcallTime=0Code language: Python (python)
In the following lines of code, pin 21 is declared as an input pin with PULL_UP enabled. The callback function will be executed when interrupt occurs, and the flow_frequency variable will be incremented by 1. A rising edge triggered interrupt is attached to the pin using pin.irq() function, and callback is specified as the function that must be called when interrupt occurs. You can also visit our article Raspberry Pi Pico External Interrupts & Button Interfacing Tutorial Using MicroPython to know about buttons and interrupts in Raspberry Pi Pico.
pin = Pin(21,Pin.IN,Pin.PULL_UP)
def callback(pin):
    global flow_frequency
    flow_frequency=flow_frequency+1
pin.irq(trigger=Pin.IRQ_RISING, handler=callback)Code language: Python (python)
The while loop first checks if the time interval since the last reading is more than 1 second. If yes, the flow rate is calculated. Then the flow_frequency variable is reset to zero. This variable will again count up every time an Interrupt occurs. Its value is checked every second to calculate the flow rate and is reset after the calculation is done. The function time.ticks_ms() increments every millisecond and is used here to calculate the time intervals. The print() function prints the output to the Serial Monitor.
while True:
    if ((time.ticks_ms()-lastcallTime) > 1000):  #if time interval is more a than 1 second
        flow_rate = (flow_frequency * 60 / 7.5)  #flowrate in L/hour= (Pulse frequency x 60 min) / 7.5
        flow_frequency = 0                       # Reset Counter
        lastcallTime=time.ticks_ms()
        print("Flow Rate={} Litres/Hour".format(flow_rate))   #print(flow_rate)Code language: PHP (php)
Display Flow Sensor Data on LCD
We will now learn to interact and display the flow rate on a 16×2 LCD display. Connect the LCD as shown in the diagram below. Pin 1(GP0) of Pico connects to the SDA pin of the LCD and Pin 2(GP1) of Pico connects to the SCL pin of the LCD.

LCD Interfacing Code
Copy and upload the following script to your Pi Pico after the connections to the LCD have been done.
# Source: Electrocredible.com, Language: MicroPython
from machine import Pin,I2C
import time
from lcd_api import LcdApi
from pico_i2c_lcd import I2cLcd
#variables for detecting flow rate
flow_frequency=0
flow_rate=0
lastcallTime=0
#variables for printing on LCD
I2C_ADDR     = 0x27
I2C_NUM_ROWS = 2
I2C_NUM_COLS = 16
lastprinttime=0

i2c = I2C(0, sda=machine.Pin(0), scl=machine.Pin(1), freq=400000)
lcd = I2cLcd(i2c, I2C_ADDR, I2C_NUM_ROWS, I2C_NUM_COLS)

pin = Pin(21,Pin.IN,Pin.PULL_UP)
def callback(pin):
    global flow_frequency
    flow_frequency=flow_frequency+1

pin.irq(trigger=Pin.IRQ_RISING, handler=callback)

def calculateFlow():
    global flow_rate, flow_frequency
    flow_rate = (flow_frequency * 60 / 7.5)  #flowrate in L/hour= (Pulse frequency x 60 min) / 7.5
    flow_frequency = 0                       # Reset Counter
def printonlcd():
    lcd.clear()
    lcd.move_to(0,0)
    string=str(flow_rate)                    #converts flow_rate variable to string type
    lcd.putstr("Flow Rate= {}".format(string))

while True:
    if ((time.ticks_ms()-lastcallTime) > 1000):  #if time interval is more than 1 second
        calculateFlow()
        lastcallTime=time.ticks_ms()

    if ((time.ticks_ms()-lastprinttime) > 500):  #prints on LCD every 500ms
        printonlcd()
        lastprinttime=time.ticks_ms()Code language: PHP (php)
To know more about how the LCD interfacing code works, you can refer to my article Raspberry Pi Pico LCD Tutorial-16×2 I2C Display(PCF8574) Interfacing Using MicroPython. If you prefer to display output on an OLED display, check out the article Raspberry Pi Pico OLED Display SSD1306 Interfacing Tutorial Using MicroPython.
I hope you found this Raspberry Pi Pico flow sensor interfacing guide to be helpful. Please leave your thoughts in the comments below. Thank you for reading.
Also, read our other articles on Raspberry Pi Pico:
Leave a Reply